Market Outlook
February 06, 2018
Market Cues
Domestic Indices
Chg (%)
(Pts)
(Close)
Indian markets are likely to open negative tracking global indices and SGX Nifty.
BSE Sensex
(0.9)
(310)
34,757
US stocks suffered one of their worst days in recent memory in the last trading
Nifty
(0.9)
(94)
10,667
session, as markets continued to throw a tantrum over rising interest rates. The Dow
Mid Cap
(0.1)
(15)
16,560
Jones ended on downside of 4.6% to close at 24,346 and the Nasdaq Composite
Small Cap
(0.4)
(66)
17,782
edged down to 3.8%, to 6,968.
Bankex
(1.1)
(333)
29,577
U.K. shares tumbled as a strong U.S. jobs report reinforced the Fed's outlook for
three interest-rate hikes this year and investors looked ahead to a new round of talks
Global Indices
Chg (%)
(Pts)
(Close)
between the U.K. and European Union starting Tuesday. The FTSE 100 was down by
Dow Jones
(4.6)
(1,175)
24,346
1.5% to close at 7,335.
Nasdaq
(3.8)
(273)
6,968
On domestic front, Indian shares fell for a fifth consecutive session, tracking weak
FTSE
(1.5)
(108)
7,335
cues from global markets, after a strong U.S. jobs report for January helped fuel
Nikkei
(5.2)
(1,171)
21,512
expectations that the Federal Reserve will lift borrowing costs more than the three
Hang Seng
(4.6)
(1,474)
30,772
times initially expected this year. The Sensex ended on a downside front of 0.9% at
Shanghai Com
(1.9)
(65)
3,422
34,757 while the Nifty ended at 10,667 with a downside of 0.9%.
News Analysis
Advances / Declines
BSE
NSE
IPO Update
- Future Supply Chain Solutions Ltd & Newgen Software
Advances
1,047
684
Technologies Ltd
Declines
1,794
1,160
Detailed analysis on Pg2
Unchanged
161
49
Investor’s Ready Reckoner
Volumes (` Cr)
Key Domestic & Global Indicators
BSE
4,760
Stock Watch: Latest investment recommendations on 150+ stocks
NSE
36,898
Refer Pg5 onwards
Top Picks
Net Inflows (` Cr)
Net
Mtd
Ytd
CMP
Target
Upside
Company
Sector
Rating
FII
1,290
2,456
15,439
(`)
(`)
(%)
Blue Star
Capital Goods
Buy
719
867
20.6
*MFs
1,051
7,386
7,386
Dewan Housing Finance
Financials
Buy
510
712
39.7
Asian Granito
Other
Buy
525
651
24.1
Top Gainers
Price (`)
Chg (%)
Navkar Corporation
Other
Buy
174
265
52.6
Bomdyeing
222
16.0
KEI Industries
Capital Goods
Buy
370
436
18.0
Pcjeweller
423
15.7
More Top Picks on Pg4
Intellect
193
12.8
Key Upcoming Events
Jubilant
956
9.2
Previous
Consensus
Date
Region
Event Description
Reading
Expectations
Polaris
450
9.2
Feb07
India
RBI Reverse Repo rate
5.75
5.75
Feb07
India
RBI Cash Reserve ratio
4.00
4.00
Top Losers
Price (`)
Chg (%)
Feb07
India
RBI Repo rate
6.00
6.00
Vakrangee
237
(10.0)
Feb08
US
Initial Jobless claims
230.00
233.00
Strtech
323
(7.5)
Feb08
UK
Industrial Production (YoY)
2.50
0.30
More Events on Pg7
Fortis
118
(6.3)
Motilalofs
1,164
(6.2)
Ajantpharm
1,311
(5.8)
As on February 5 2018
Market Outlook
February 06, 2018
News Analysis
IPO Update - Future Supply Chain Solutions Ltd & Newgen Software
Technologies Ltd
We had given a Neutral rating on the Future Supply Chain Solutions Ltd &
Newgen Software Technologies Ltd IPO which came with a price band of 660-664
and 240-245 respectively. Currently they are trading at a price of Rs. 670.00 and
Rs. 231.75 which hardly given any return since listing.
Though Future Supply Chain Solutions Ltd is one of the largest third-party logistics
service providers in India, the past track record data doesn’t give significant
confidence in the near term.
Similarly Newgen Software Technologies Ltd listed at a valuation of PE 30.6x which
is comparatively high in comparison to Intellect Design arena. Further last four
years historical financial records and 1HFY18 left limited scope for further
appreciation.
Economic and Political News
Centre released Rs 516 billion to states under MGNREGA in 2017-18
Import duty on sugar may be hiked to 100% to protect farmers
LTCG tax to apply on shares sold after Apr 1, evaluation on Jan 31 price
Corporate News
HDFC ERGO cuts motor premiums by up to 15% for existing and new
customers
Airbus, Boeing eye 16,000-plane jackpot as Asian aviation market expands
Tier-II drive: Swiggy enters Jaipur, ties up with 300 restaurants
Samsung heir walks free after South Korea court suspends 5-year jail term
Market Outlook
February 06, 2018
Quarterly Bloomberg Brokers Consensus Estimate
Lupin Ltd - Feb 06, 2018
Particulars ( ` cr)
3QFY18E
3QFY17
y-o-y (%)
2QFY18
q-o-q (%)
Sales
3969
4482
(11.4)
3951
0.5
EBIDTA
841
1215
(30.8)
853
(1.4)
%
21.2
27.1
21.6
PAT
426
633
(32.7)
455
(6.4)
HeroMotoCorp Ltd. - Feb 06, 2018
Particulars ( ` cr)
3QFY18E
3QFY17
y-o-y (%)
2QFY18
q-o-q (%)
Sales
7252
6364
13.9
8362
(13.3)
EBIDTA
1166
1079
8.0
1456
(19.9)
%
16.1
17.0
17.4
PAT
1134
772
46.9
1010
12.3
REC Ltd. - Feb 06, 2018
Particulars ( ` cr)
3QFY18E
3QFY17
y-o-y (%)
2QFY18
q-o-q (%)
PAT
1460
1754
(16.7)
1214
20.3
Tata Chemical Ltd. - Feb 06, 2018
Particulars ( ` cr)
3QFY18E
3QFY17
y-o-y (%)
2QFY18
q-o-q (%)
Sales
3524
3416
3.2
3462
1.8
EBIDTA
598
592
1.0
686
(12.8)
%
16.9
17.3
19.8
PAT
314
318
(1.3)
419
(25.1)
PNB Ltd. - Feb 06, 2018
Particulars ( ` cr)
3QFY18E
3QFY17
y-o-y (%)
2QFY18
q-o-q (%)
PAT
556
207
168.6
560
(0.7)
Market Outlook
February 06, 2018
Top Picks
Market Cap
CMP
Target
Upside
Company
Rationale
(` Cr)
(`)
(`)
(%)
Strong growth in domestic business due to its leade`hip
in acute therapeutic segment. Alkem expects to launch
Alkem Laboratories
25,907
2,167
2,441
12.7
more products in USA, which bodes for its international
business.
We expect the company would report strong profitability
Asian Granito
1,579
525
651
24.1
owing to better product mix, higher B2C sales and
amalgamation synergy.
Favorable outlook for the AC industry to augur well for
Cooling products business which is out pacing the
Blue Star
6,898
719
867
20.6
market growth. EMPPAC division's profitability to
improve once operating environment turns around.
With a focus on the low and medium income (LMI)
consumer segment, the company has increased its
Dewan Housing Finance
15,990
510
712
39.7
presence in tier-II & III cities where the growth
opportunity is immense.
Loan growth is likely to pick up after a sluggish FY17.
Lower credit cost will help in strong bottom-line growth.
Karur Vysya Bank
8,151
112
160
42.6
Increasing share of CASA will help in NIM
improvement.
High order book execution in EPC segment, rising B2C
KEI Industries
2,896
370
436
18.0
sales and higher exports to boost the revenues and
profitability
Expected to benefit from the lower capex requirement
Music Broadcast
2,088
366
475
29.8
and 15 year long radio broadcast licensing.
Massive capacity expansion along with rail advantage
Navkar Corporation
2,613
174
265
52.6
at ICD as well CFS augur well for the company
Strong brands and distribution network would boost
Siyaram Silk Mills
2,905
620
851
37.3
growth going ahead. Stock currently trades at an
inexpensive valuation.
Market leadership in Hindi news genre and no.
2
viewership ranking in English news genre, exit from the
TV Today Network
2,696
452
500
10.6
radio business, and anticipated growth in ad spends by
corporate to benefit the stock.
After GST, the company is expected to see higher
volumes along with improving product mix. The Gujarat
Maruti Suzuki
2,74,552
9,089
10,619
16.8
plant will also enable higher operating leverage which
will be margin accretive.
We expect loan book to grow at 24.3% over next two
GIC Housing
2,165
402
655
62.9
year; change in borrowing mix will help in NIM
improvement
We expect CPIL to report net Revenue/PAT CAGR of
~17%/16% over FY2017-20E mainly due to healthy
6,734
303
400
32.0
growth in plywood & lamination business, forayed into
Century Plyboards India
MDF & Particle boards on back of strong brand &
distribution network.
We expect sales/PAT to grow at 13.5%/20% over next
LT Foods
2,875
90
128
42.4
two years on the back of strong distribution network &
addition of new products in portfolio.
We expect sales/PAT to grow at 13%/16% over next two
years on the back of strong healthy demand in writing
Ruchira Papers
379
169
244
44.3
& printing paper and Kraft paper. Further, China had
banned making paper from waste pulp which would
benefit Indian paper companies.
We expect financialisation of savings and increasing
Aditya Birla Capital
36942
167
230
37.7
penetration in Insurance & Mutual fund would ensure
steady growth.
Source: Company, Angel Research
Market Outlook
February 06, 2018
Fundamental Call
Market Cap
CMP
Target
Upside
Company
Rationale
(` Cr)
(`)
(`)
(%)
CCL is likely to maintain the strong growth trajectory
CCL Products
3,741
281
360
28.0
over FY18-20 backed by capacity expansion and new
geographical foray
We forecast Nilkamal to report top-line CAGR of ~9%
to `2,635cr over FY17-20E on the back of healthy
Nilkamal
2,493
1,671
2,178
30.4
demand growth in plastic division. On the bottom-line
front, we estimate ~10% CAGR to `162cr owing to
improvement in volumes.
We expect sales/PAT to grow at 9%/14% over next two
years on the back of healthy demand growth in
Shreyans Industries
234
170
247
45.7
printing. Further, China had banned making paper
from waste pulp which would benefit Indian paper
companies.
The prism has diversified exposure in the different
segment such as Cement, Tile & ready mix concrete.
Prism Cement
6,385
127
160
26.1
Thus we believe, PCL is in the right place to capture
ongoing government spending on affordable housing
and infrastructure projects.
Source: Company, Angel Research
Market Outlook
February 06, 2018
Key Upcoming Events
Result Calendar
Date
Company
February 06, 2018
Tata Chemicals, Hero Motocorp, Apollo Tyres, Siemens, Thermax, Blue Star, KEC International
February 07, 2018
FAG Bearings, Areva, BGR Energy , Hexaware, Indraprasth Gas, Elecon Engineering, Cipla, Aurobindo Pharma
Source: Bloomberg, Angel Research
Global economic events release calendar
Bloomberg Data
Date
Time
Country
Event Description
Unit
Period
Last Reported
Estimated
Feb 07, 2018
2:30 PMIndia
RBI Reverse Repo rate
%
Feb 7
5.75
5.75
2:30 PMIndia
RBI Cash Reserve ratio
%
Feb 7
4.00
4.00
2:30 PMIndia
RBI Repo rate
%
Feb 7
6.00
6.00
Feb 08, 2018
7:00 PMUS
Initial Jobless claims
Thousands
Feb 3
230.00
233.00
3:00 PMUK
Industrial Production (YoY)
% Change
Dec
2.50
0.30
China
Exports YoY%
% Change
Jan
10.90
10.80
Feb 09, 2018
5:30 PMUK
BOE Announces rates
% Ratio
Feb 8
0.50
0.50
7:00 AMChina
Consumer Price Index (YoY)
% Change
Jan
1.80
1.50
Feb 12, 2018
5:30 PMIndia
Industrial Production YoY
% Change
Dec
8.40
Feb 13, 2018
3:00 PMUK
CPI (YoY)
% Change
Jan
3.00
Feb 14, 2018
3:30 PMEuro Zone Euro-Zone GDP s.a. (QoQ)
% Change
4Q P
0.60
12:00 PMIndia
Monthly Wholesale Prices YoY%
% Change
Jan
3.58
7:00 PMUS
Consumer price index (mom)
% Change
Jan
0.10
0.30
12:30 PMGermany GDP nsa (YoY)
% Change
4Q P
2.30
Feb 15, 2018
7:45 PMUS
Industrial Production
%
Jan
0.89
0.30
Source: Bloomberg, Angel Research
Market Outlook
February 06, 2018
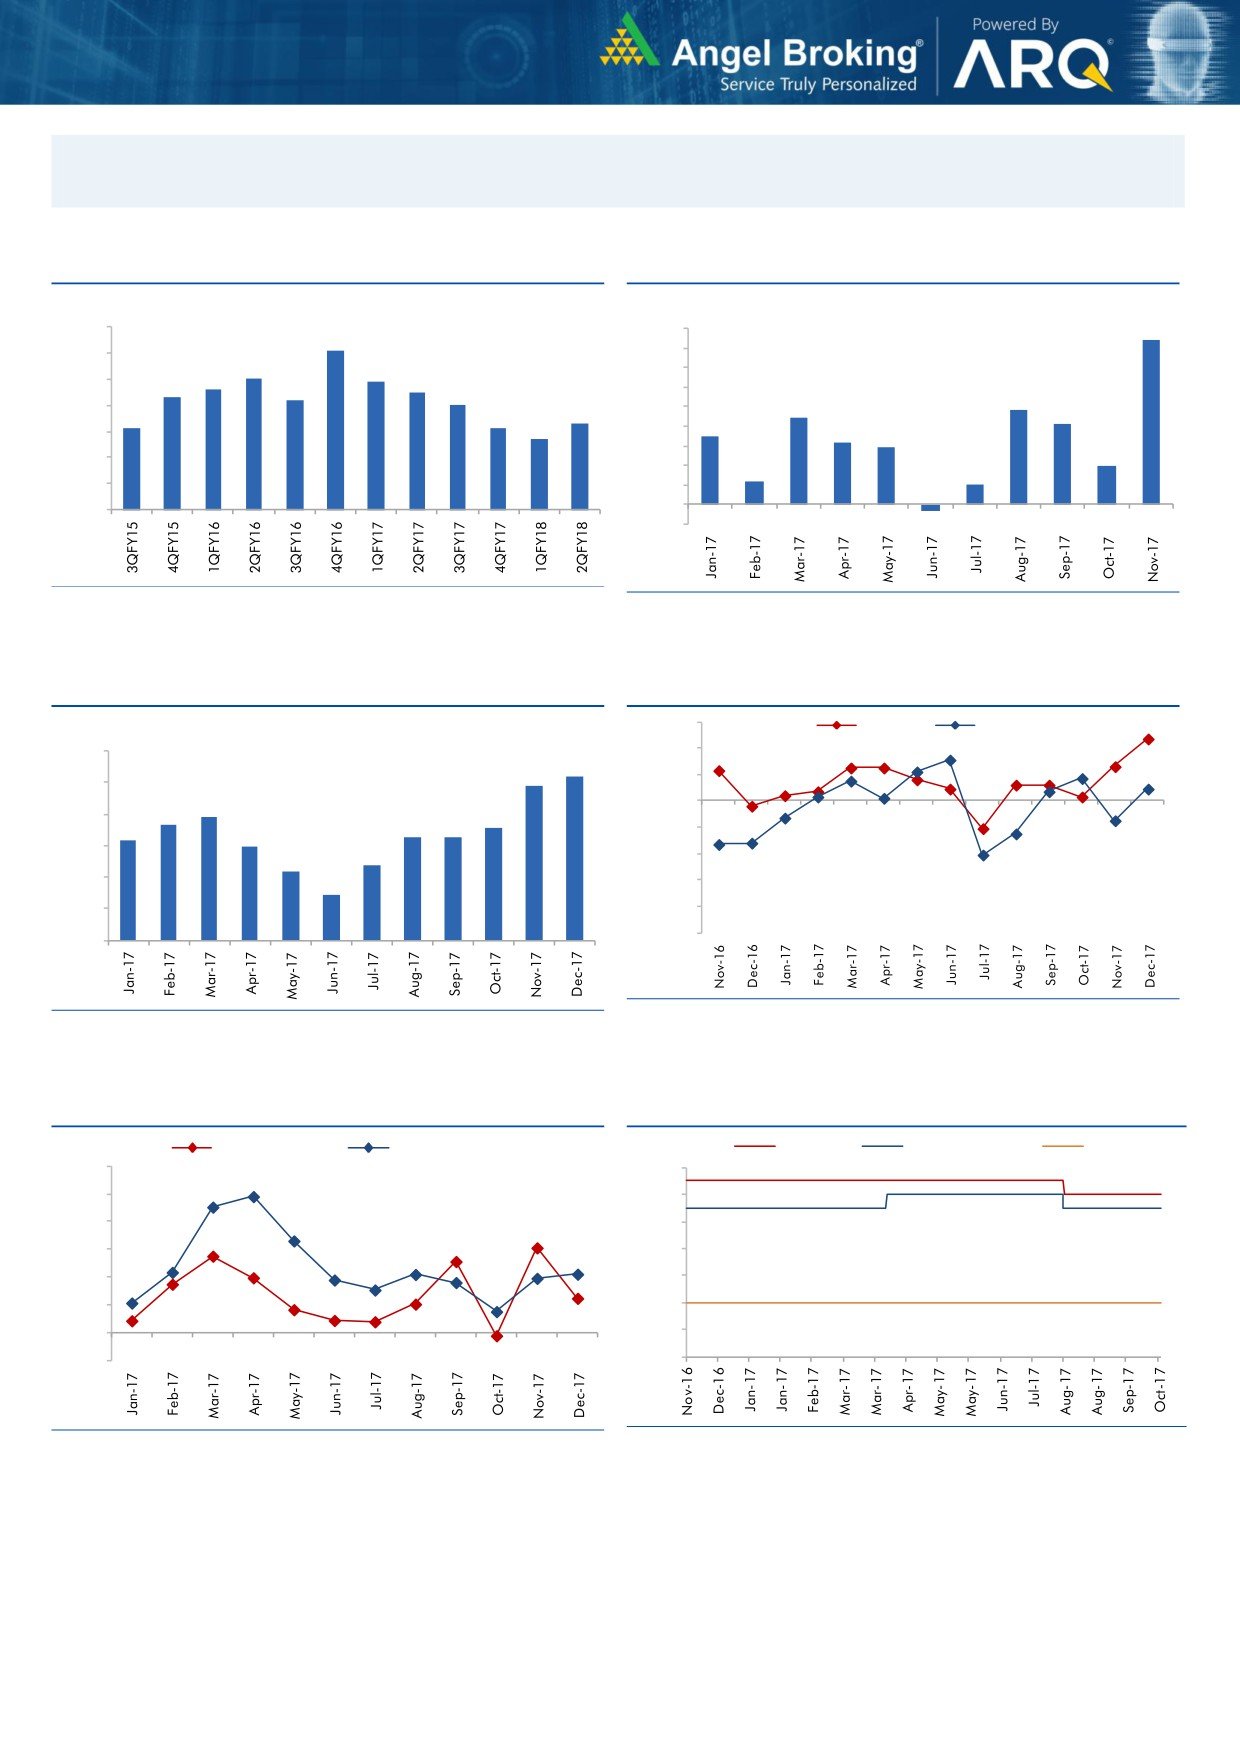
Macro watch
Exhibit 1: Quarterly GDP trends
Exhibit 2: IIP trends
(%)
(%)
10.0
9.0
8.4
9.1
9.0
8.0
8.0
7.9
7.0
7.6
7.5
8.0
7.3
7.2
7.0
6.0
4.8
7.0
6.3
5.0
4.4
4.1
6.1
6.1
5.7
3.5
3.2
6.0
4.0
2.9
3.0
2.0
5.0
2.0
1.2
1.0
4.0
1.0
-
3.0
(1.0)
(0.3)
Source: CSO, Angel Research
Source: MOSPI, Angel Research
Exhibit 3: Monthly CPI inflation trends
Exhibit 4: Manufacturing and services PMI
56.0
Mfg. PMI
Services PMI
(%)
6.0
54.0
5.2
4.9
52.0
5.0
3.9
50.0
3.7
3.6
4.0
3.3
3.3
3.2
3.0
48.0
3.0
2.4
2.2
46.0
2.0
1.5
44.0
1.0
42.0
40.0
-
Source: Market, Angel Research; Note: Level above 50 indicates expansion
Source: MOSPI, Angel Research
Exhibit 5: Exports and imports growth trends
Exhibit 6: Key policy rates
(%)
Exports yoy growth
Imports yoy growth
(%)
Repo rate
Reverse Repo rate
CRR
60.0
6.50
50.0
6.00
40.0
5.50
30.0
5.00
20.0
4.50
10.0
4.00
0.0
3.50
(10.0)
3.00
Source: Bloomberg, Angel Research
Source: RBI, Angel Research
Market Outlook
February 06, 2018
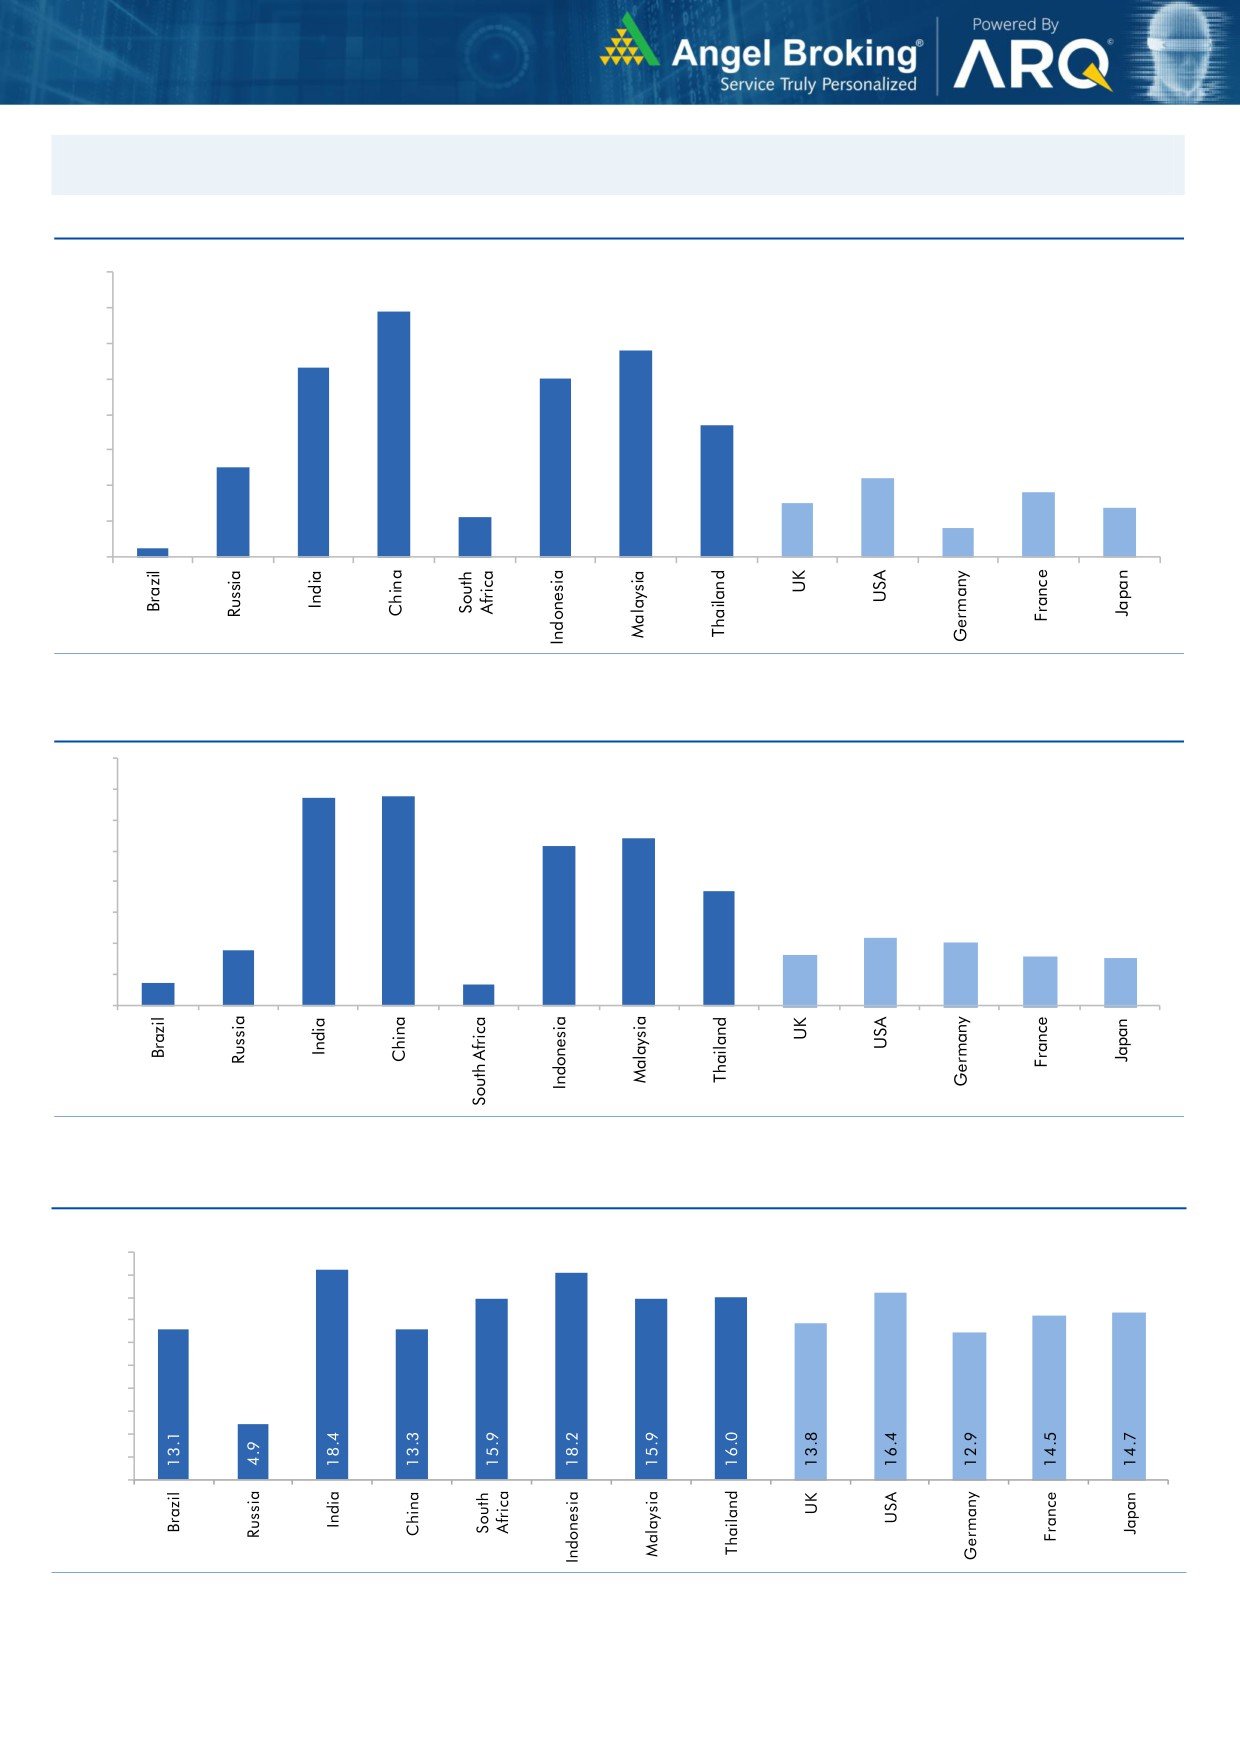
Global watch
Exhibit 1: Latest quarterly GDP Growth (%, yoy) across select developing and developed countries
(%)
8.0
6.9
7.0
5.8
6.0
5.3
5.0
5.0
1.1
3.7
4.0
2.5
3.0
2.2
1.8
2.0
1.5
1.4
0.8
1.0
0.3
-
Source: Bloomberg, Angel Research
Exhibit 2: 2017 GDP Growth projection by IMF (%, yoy) across select developing and developed countries
(%)
6.7
6.8
7.0
6.0
5.4
5.2
5.0
3.7
4.0
3.0
1.8
2.2
2.0
1.7
1.6
2.0
0.7
1.5
0.7
1.0
-
Source: IMF, Angel Research
Exhibit 3: One year forward P-E ratio across select developing and developed countries
(x)
20.0
18.0
16.0
14.0
12.0
10.0
8.0
6.0
4.0
2.0
-
Source: IMF, Angel Research
Market Outlook
February 06, 2018
Exhibit 4: Relative performance of indices across globe
Returns (%)
Country
Name of index
Closing price
1M
3M
1YR
Brazil
Bovespa
81,861
5.0
7.7
24.0
Russia
Micex
2,277
5.8
9.3
2.3
India
Nifty
10,667
2.1
2.0
22.4
China
Shanghai Composite
3,487
0.9
0.2
9.0
South Africa
Top 40
50,496
(4.1)
(4.4)
10.1
Mexico
Mexbol
50,396
1.2
3.2
7.0
Indonesia
LQ45
1,107
1.3
9.2
23.4
Malaysia
KLCI
1,853
3.9
6.0
10.3
Thailand
SET 50
1,175
0.7
7.9
17.7
USA
Dow Jones
24,346
(2.3)
3.9
21.4
UK
FTSE
7,335
(4.7)
(2.9)
2.1
Japan
Nikkei
22,682
(0.4)
3.0
17.1
Germany
DAX
12,687
(3.6)
(5.6)
10.2
France
CAC
5,286
(2.4)
(4.1)
9.5
Source: Bloomberg, Angel Research p68in4
Market Outlook
February 06, 2018
Research Team Tel: 022 - 39357800
DISCLAIMER
Angel Broking Private Limited (hereinafter referred to as “Angel”) is a registered Member of National Stock Exchange of India
Limited,Bombay Stock Exchange Limited and Metropolitan Stock Exchange Limited. It is also registered as a Depository Participant with
CDSL and Portfolio Manager with SEBI. It also has registration with AMFI as a Mutual Fund Distributor. Angel Broking Private Limited is a
registered entity with SEBI for Research Analyst in terms of SEBI (Research Analyst) Regulations, 2014 vide registration number
INH000000164. Angel or its associates has not been debarred/ suspended by SEBI or any other regulatory authority for accessing
/dealing in securities Market. Angel or its associates/analyst has not received any compensation / managed or
co-managed public offering of securities of the company covered by Analyst during the past twelve months.
This document is solely for the personal information of the recipient, and must not be singularly used as the basis of any investment
decision. Nothing in this document should be construed as investment or financial advice. Each recipient of this document should make
such investigations as they deem necessary to arrive at an independent evaluation of an investment in the securities of the companies
referred to in this document (including the merits and risks involved), and should consult their own advisors to determine the merits and
risks of such an investment.
Reports based on technical and derivative analysis center on studying charts of a stock's price movement, outstanding positions and
trading volume, as opposed to focusing on a company's fundamentals and, as such, may not match with a report on a company's
fundamentals. Investors are advised to refer the Fundamental and Technical Research Reports available on our website to evaluate the
contrary view, if any.
The information in this document has been printed on the basis of publicly available information, internal data and other reliable
sources believed to be true, but we do not represent that it is accurate or complete and it should not be relied on as such, as this
document is for general guidance only. Angel Broking Pvt. Limited or any of its affiliates/ group companies shall not be in any way
responsible for any loss or damage that may arise to any person from any inadvertent error in the information contained in this report.
Angel Broking Pvt. Limited has not independently verified all the information contained within this document. Accordingly, we cannot
testify, nor make any representation or warranty, express or implied, to the accuracy, contents or data contained within this document.
While Angel Broking Pvt. Limited endeavors to update on a reasonable basis the information discussed in this material, there may be
regulatory, compliance, or other reasons that prevent us from doing so.
This document is being supplied to you solely for your information, and its contents, information or data may not be reproduced,
redistributed or passed on, directly or indirectly.
Neither Angel Broking Pvt. Limited, nor its directors, employees or affiliates shall be liable for any loss or damage that may arise from
or in connection with the use of this information.